

Last month, Google announced the release of Google Analytics 4 (also known as App + Web property), which is basically a “new” version of the famous web analytics software.
In this post, I won’t talk about the differences between the old Google Analytics (Universal Analytics) and GA4 because it’s still a beta version and they are releasing every day new features. So, if you want to know all the new features of GA4 you should read this post.
Instead, I’ll try to cover all the basic aspects you should know if you want to start to analyze Google Analytics raw data that you can import (for free) in BigQuery.
This post is mainly for people with a basic knowledge of SQL and understanding of how a relational database works.
An overview of the Google BigQuery GUI
In order to get started, you have to connect Google Analytics and Google Big Query, here you can find the official documentation which will guide you through the setup process.

After the initial setup, you should be able to access the BigQuery interface. On the left there is a sidebar where you’ll find:
- Query history: where you can find all the queries you ran in the past
- Saved queries: if you don’t want to lose your queries, you can save them in the Saved queries section
- Scheduled queries: of course, you can also schedule a query and run it every day, week,…
- Resources: in this section, you’ll find all your projects. In each project, you’ll find one or more dataset and in each dataset, you’ll find one or more tables
While in the main section of the console you can find:
- SQL editor: where you’ll write the SQL queries. But you’ll also be able to save, schedule and format your code
- Output & dataset details: the last section of the interface contains the output area where you’ll be able to check the output of your queries but at the same time find more details about you tables (e.g. field names, dataset names, table size,…)
Google Analytics 4 export schema & first queries
As I said before, you can’t work with BigQuery if you don’t know a bit of SQL. So if you’ve never used it my advice is to read a guide about the basics of SQL.
In the BigQuery interface, you should also be able to see all your BigQuery projects with inside multiple datasets (one for each Google Analytics property you’ve connected).
Inside each dataset, you’ll find multiple tables, that happens because of the Google Analytics export which split the events data by day, meaning that every single table contains only the data collected during a specific day.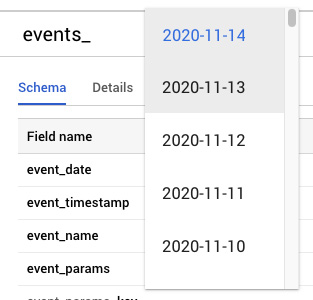
And that’s why I want to show how to query multiple table at the same time.
Query multiple Google Analytics 4 tables
As you can see in the code below, you can query multiple tables in three different ways.
You can choose a static date range (e.g. 2020-10-01 / 2020-10-15), which is recommended if you are writing a query that you’ll only use once. Or, you can use a dynamic date range like “Last 30 days” which is quite often used for reports or scheduled queries.
You can also mix the first two methods and have a dynamic and static date range.
|
1 2 3 4 5 6 7 8 9 10 11 12 13 14 15 16 |
-- Option 1 - Static date range SELECT * FROM `ga-data-XXXXXX.analytics_XXXXXXXXX.events_*` WHERE _TABLE_SUFFIX BETWEEN '20201101' AND '20201114'; -- Option 2 - Flexible date range (e.g. Last 30 days - Yesterday) SELECT * FROM `ga-data-XXXXXX.analytics_XXXXXXXXX.events_*` WHERE _TABLE_SUFFIX BETWEEN FORMAT_DATE('%Y%m%d',DATE_SUB(CURRENT_DATE(), INTERVAL 30 DAY)) AND FORMAT_DATE('%Y%m%d',DATE_SUB(CURRENT_DATE(), INTERVAL 1 DAY)); -- Option 3 - A mix of static and flexible date range SELECT * FROM `ga-data-XXXXXX.analytics_XXXXXXXXX.events_*` WHERE _TABLE_SUFFIX BETWEEN '20201001' AND FORMAT_DATE('%Y%m%d',DATE_SUB(CURRENT_DATE(), INTERVAL 1 DAY)); |
The last thing you should know about BigQuery before writing your first lines of SQL is how to deal with repeated records.
Handle nested fields / repeated records
Repeated records? What? Of course, I’ll try to quickly explain it with my own words, but, if you want to know everything about nested fields / repeated records, you should read this post written by the Firebase team.
If you are familiar with Excel or databases, you probably know that a table has rows and columns and inside each unit (cell) there is a single piece of information.

Well, Google Analytics data are organized in a slightly different way (because it’s more efficient). The structure of the Google Analytics tables looks like a JSON, which means that a column can contain a single piece of information but as well an array (a list) of values.
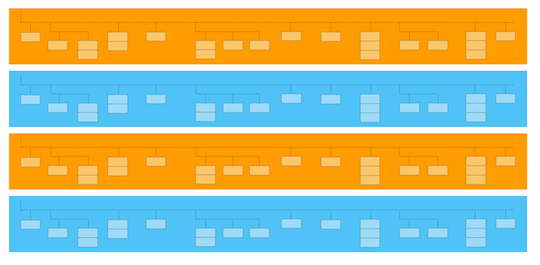
So you’ll have to know how to flatten a nested field in order to be able to query the table.
For example, the column event_params is a repeated record because inside it contains the value event_params.key, event_params.value,… .

And if you open the table preview, you’ll see something like that:

Let’s say that you want to filter the table to get only the rows where the page_referrer is “https://www.google.it”.
|
1 2 3 4 5 |
SELECT event_date, event_timestamp, event_name, page_referrer FROM `ga-data-XXXXXX.analytics_XXXXXXXXX.events_*` WHERE _TABLE_SUFFIX BETWEEN '20201101' AND '20201121' AND event_name = 'first_visit' AND page_referrer = 'https://www.google.it'; |
![]() If you run the query, you’ll get an error message because your WHERE condition is using page_referrer which is nested inside the column event_param.
If you run the query, you’ll get an error message because your WHERE condition is using page_referrer which is nested inside the column event_param.
If you want to use page_referrer you have to first flatten the nested field using the command CROSS JOIN UNNEST (or , UNNEST)which basically creates a new column
You have to add the , UNNEST in the FROM statement and specify the nested field you want to flatten.
|
1 2 3 4 |
SELECT event_date, event_timestamp, event_name, params FROM `ga-data-XXXXXX.analytics_XXXXXXXXX.events_*`, UNNEST(event_params) AS params WHERE _TABLE_SUFFIX BETWEEN '20201101' AND '20201121' AND event_name = 'first_visit'; |
And you’ll get this. All the params.key have their own row.

Then you can in the WHERE condition the filter for “https://www.google.it”
|
1 2 3 4 5 |
SELECT event_date, event_timestamp, event_name, params FROM `ga-data-XXXXXX.analytics_XXXXXXXXX.events_*`, UNNEST(event_params) AS params WHERE _TABLE_SUFFIX BETWEEN '20201101' AND '20201121' AND event_name = 'first_visit' AND params.value.string_value = "https://www.google.it/"; |
Finally, you get the output you needed.

How to create a scheduled query in BigQuery and connect it to Data Studio
Last but not least, in this post, I want to explain how to schedule a query in Google BigQuery.
Instead of manipulating your GA data in Data Studio, you can do that using an SQL query which automatically updates a table every hour, day,… .
For example, the query below counts the daily unique users of the last 30 days.
|
1 2 3 4 5 |
SELECT event_date, COUNT(DISTINCT user_pseudo_id) AS uniqueUsers FROM `ga-data-XXXXXX.analytics_XXXXXXXXX.events_*` WHERE _TABLE_SUFFIX BETWEEN FORMAT_DATE('%Y%m%d',DATE_SUB(CURRENT_DATE(), INTERVAL 30 DAY)) AND FORMAT_DATE('%Y%m%d',DATE_SUB(CURRENT_DATE(), INTERVAL 1 DAY)); GROUP BY event_date; |
If you want to schedule it, you have to click on Schedule query.

You should give a name to the scheduled query and choose when and how often update it.
In my example, I decided to update the query daily and store the results in a new table called test_scheduled_query. The data are overwritten every day.

Then you have to open Google Data Studio and choose the BigQuery connector. Here, you’ll find the test_scheduled_query table which you can use to create a dashboard.
